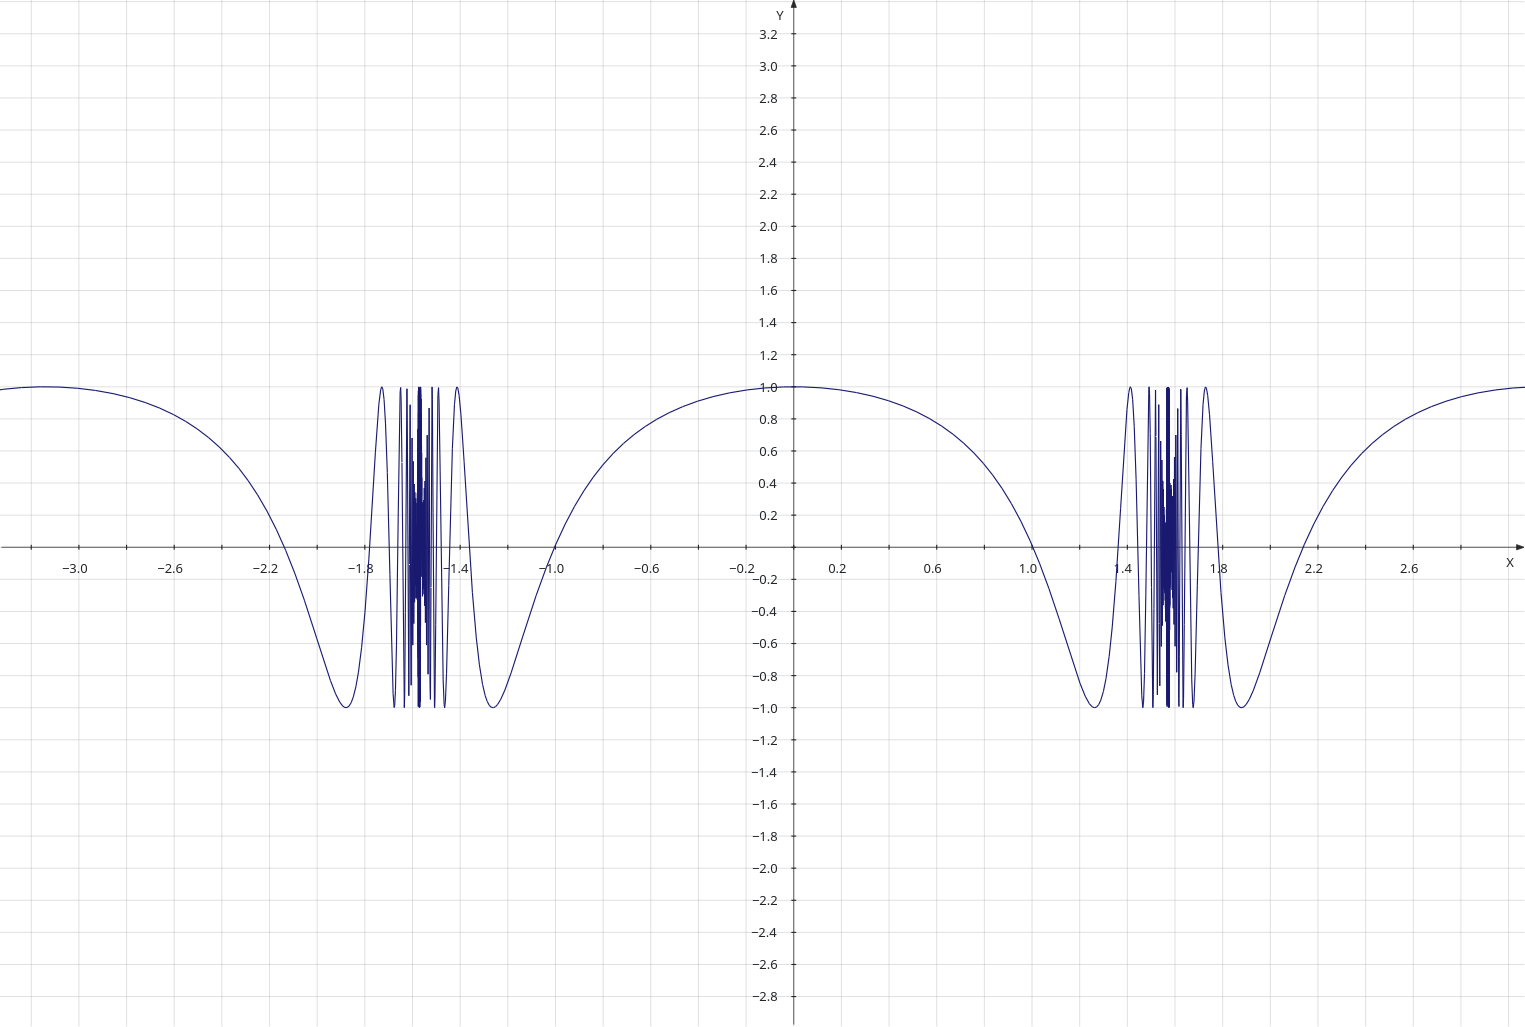

I created the above image using a program called ‘KmPlot’. It is a program for the KDE desktop for plotting mathematical functions. The function that I used for the above is something like the following:-
2∙cos(y) + 1.5∙sin(3y) = cos(5x) −0.5∙sin(9x)I don’t plot these curves for scientific or mathematical reasons, and that is why I can’t be 100% sure of which function(s) I actually used. I plot these curves simply to create shapes and designs which I find attractive.
I continually tweak the equations that I use until I find something that I like. There is an endless array of possibilities, even with very similar equations and for example the following image:-
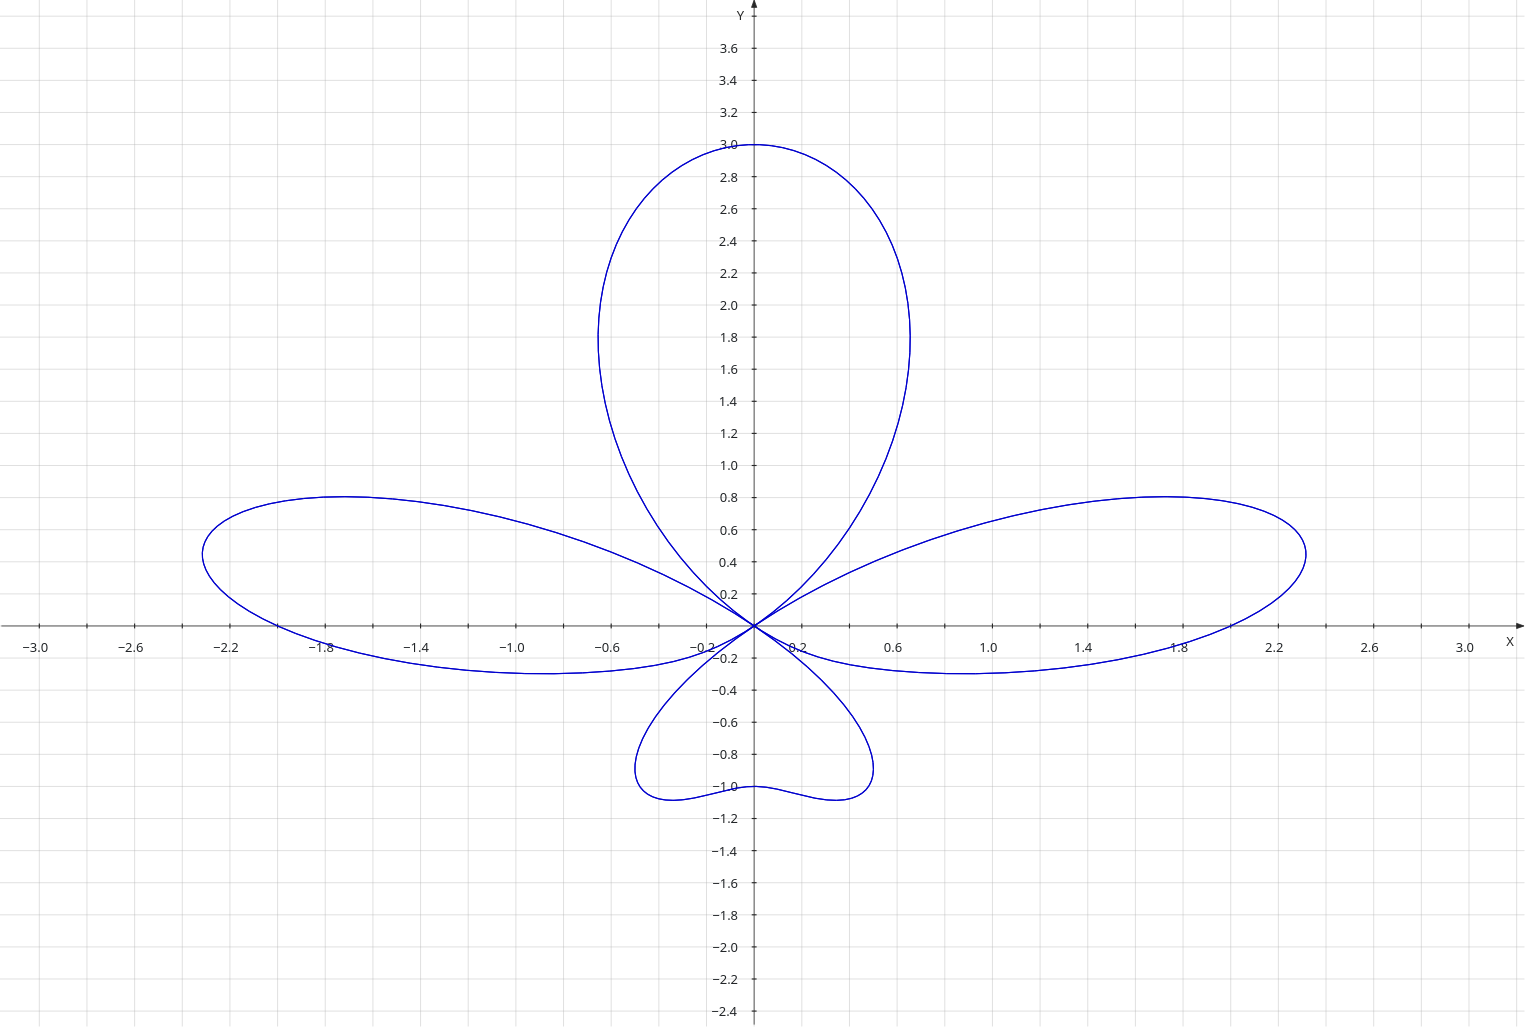
The equation in this case is:-
k(x) = tan(tan(x))The two plots above use trigonometric functions, exponential function can produce some interesting images, too, like this one:-
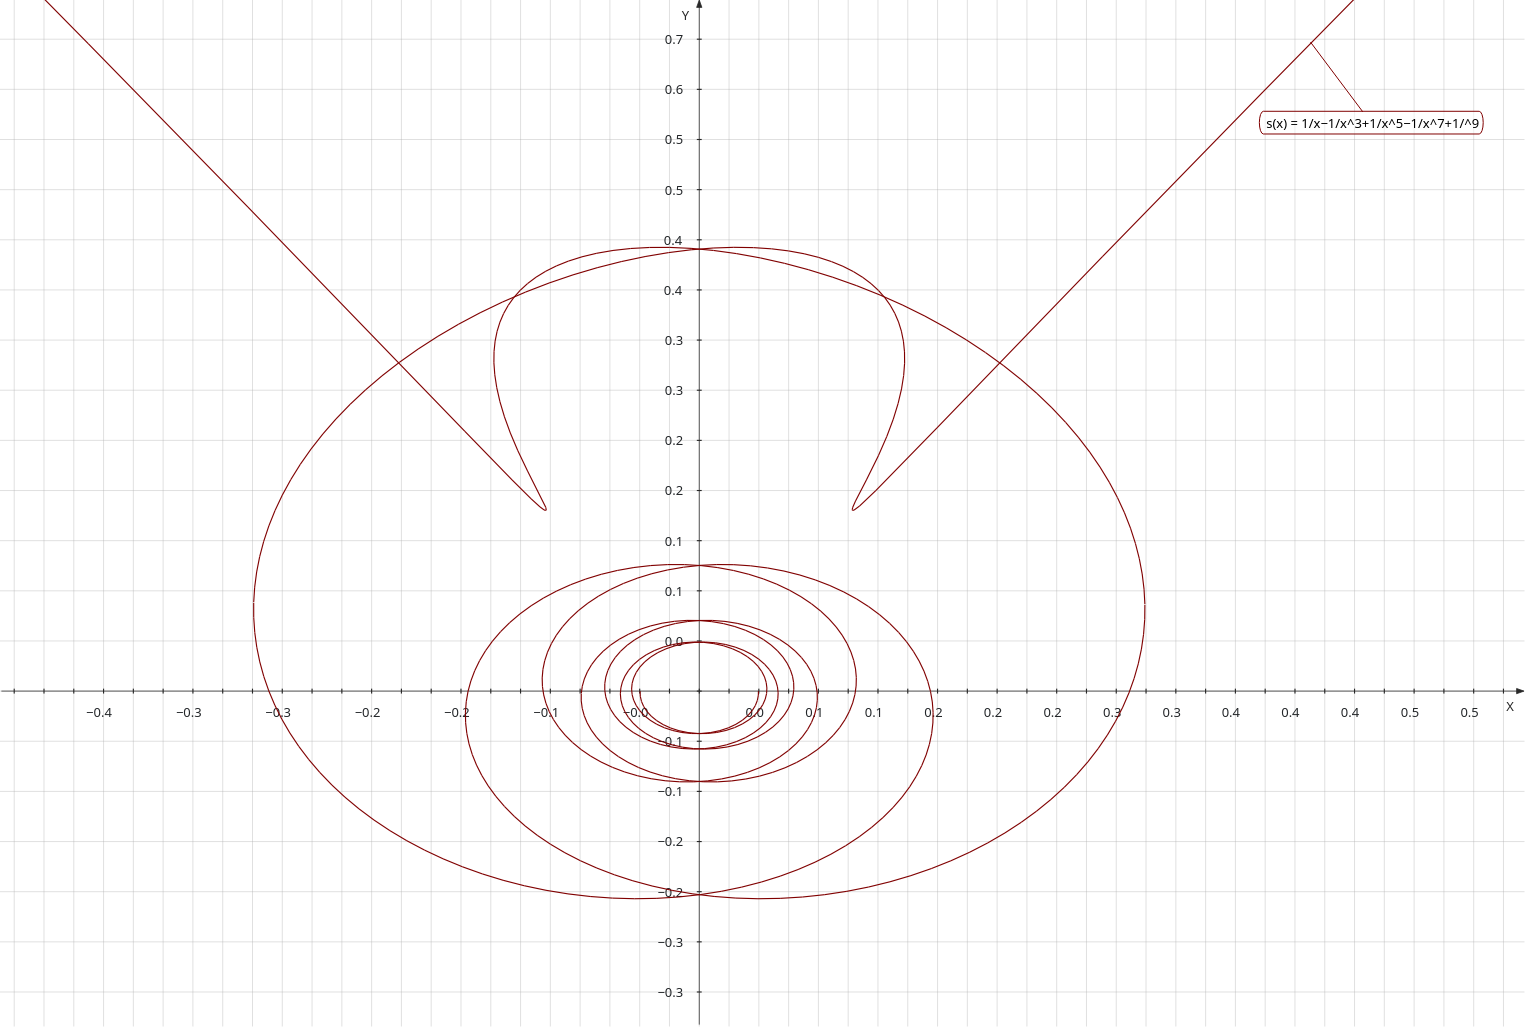
The equation of this curve is simply:-
s(x) = 1/x−1/x^3+1/x^5−1/x^7+1/^9I just fiddle with these equations to produce new images. For instance, the above equation has alternating terms. What would happen if I changed all the negative terms to positive ones. This is the answer to that question:-

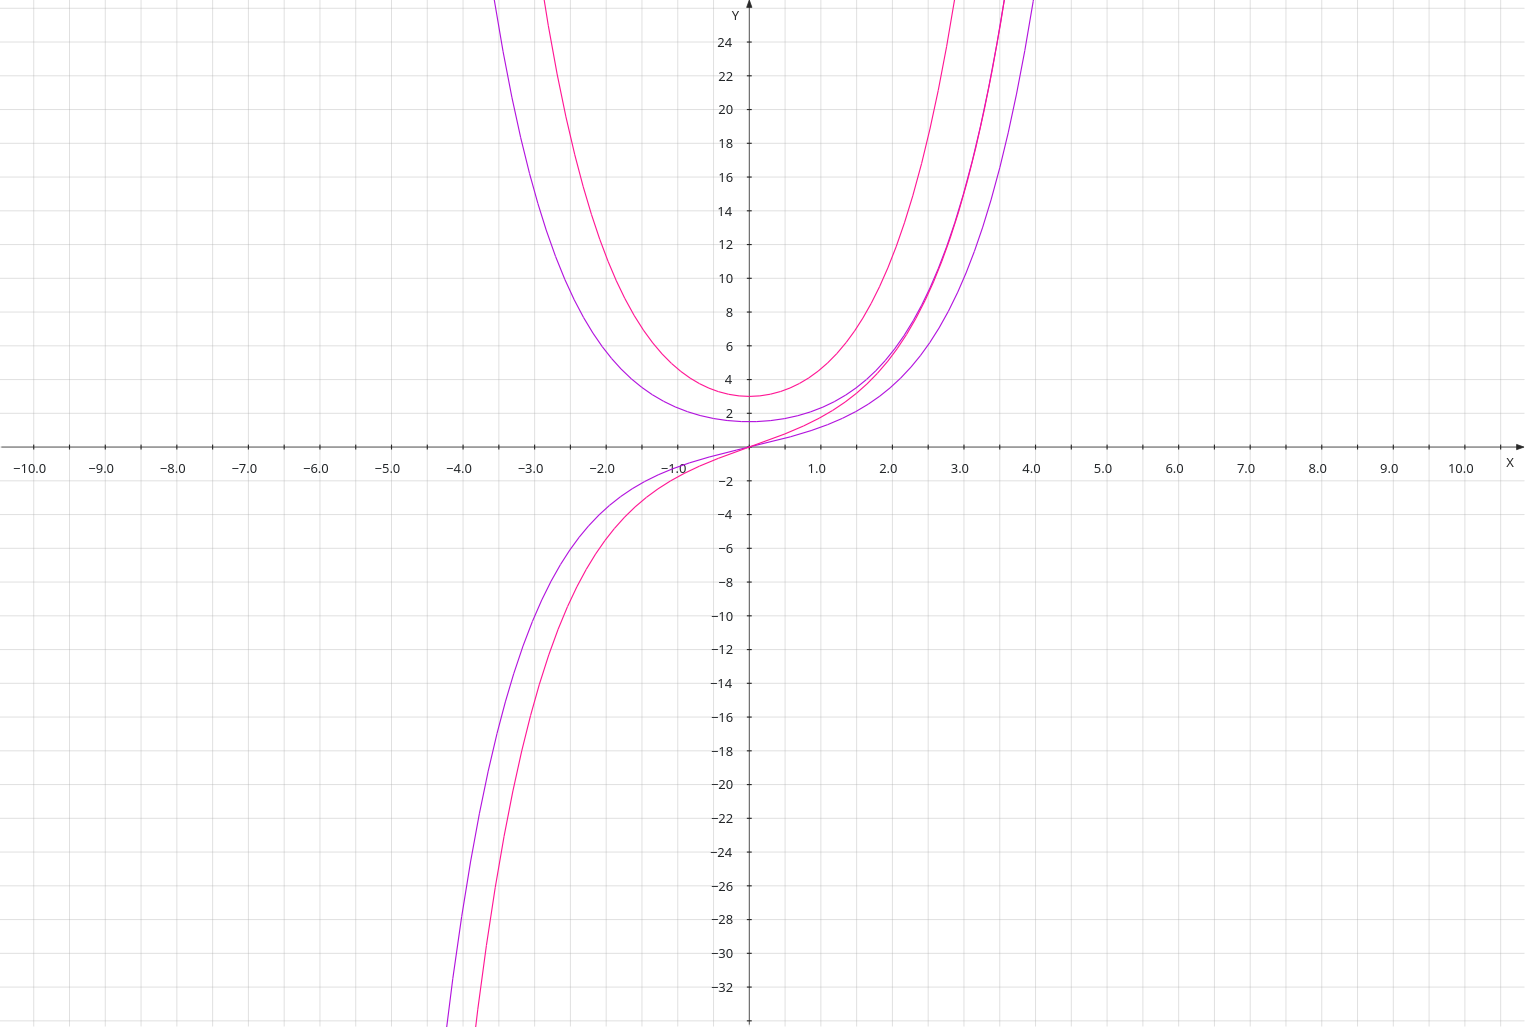
It is similar but different. The equation is as follows:-
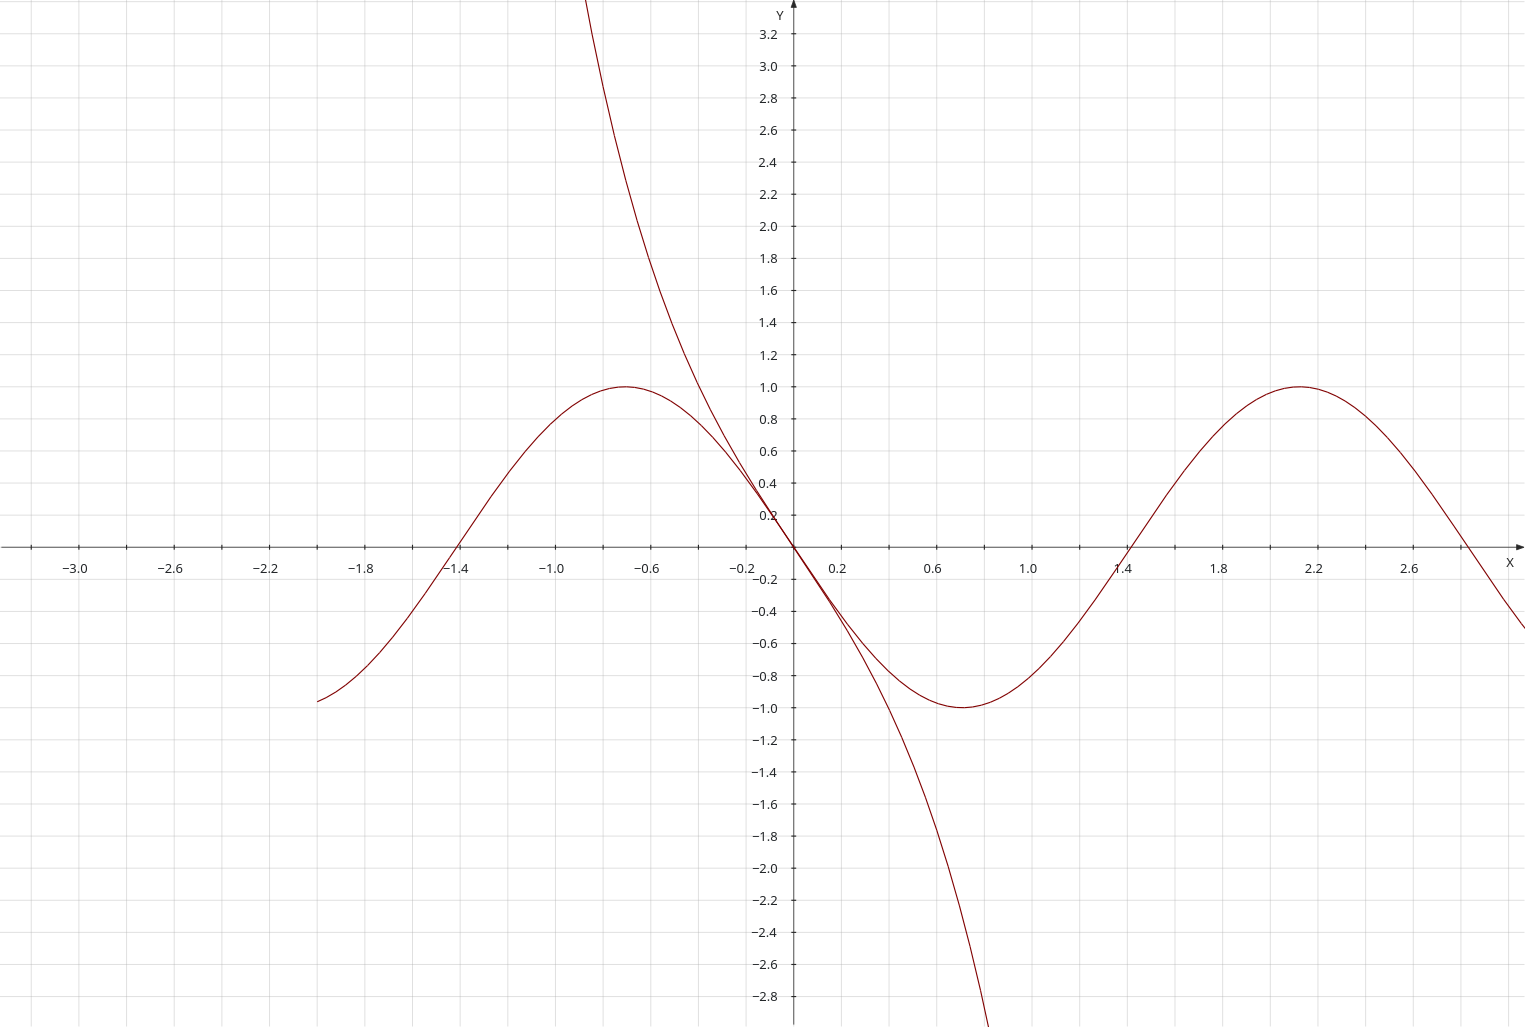
s(x) = 1/x+1/x^3+1/x^5+1/x^7+1/^9Just adding sine and cosine terms together sometimes produces interesting results. Here’s one:-

In the case of these curves, the main function is made up of multiple smaller functions, so I can’t post the formula, unfortunately. A few simple curves plotted on the same plot can produce interesting images. Below is a plot of four curves of the hyperbolic trig functions, sinh and cosh. It demonstrates how an interesting image can be built up from several curves:-
At the time I created that I was trying to recreate the following image. I have the image, but I don’t have the source! It is long gone:-
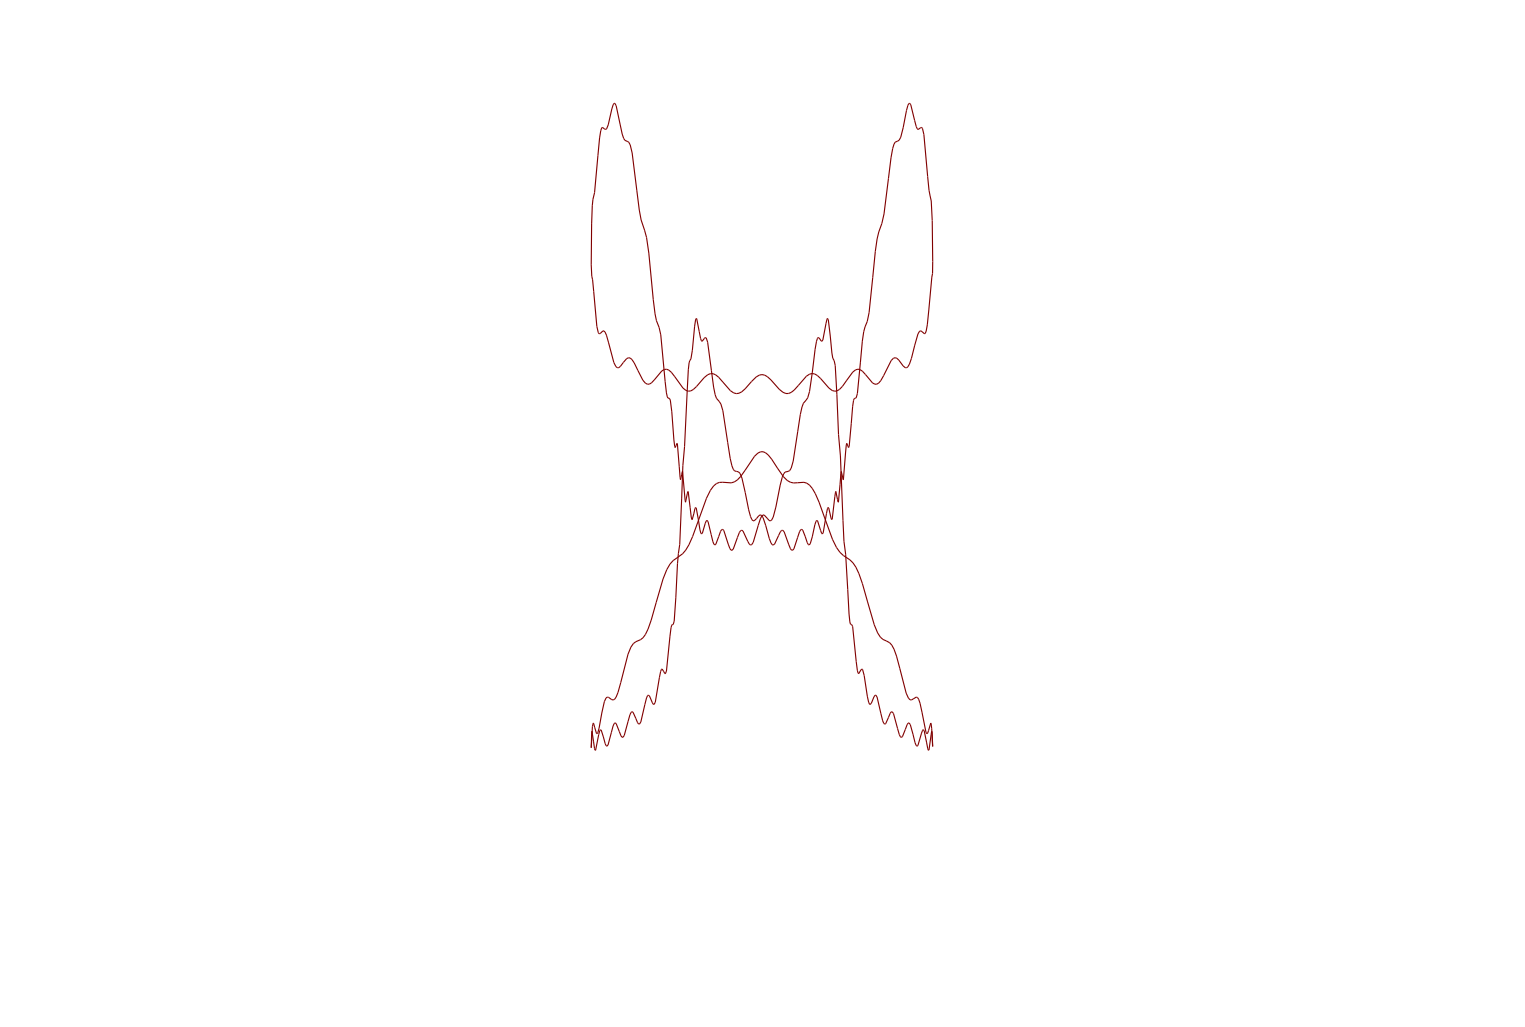
Just by fiddling with the functions and adding and multiplying them together can serendipitously result in interesting images. Here’s one. I don’t recall how I created it:-

My penultimate image is the result of trying to re-create the above image. It resembles a drawing of a flying creature, and results from lucky mistakes in copying the equations:-
That’s it for now. KmPlot allows you to create simple or complex shapes using only a little bit of elementary maths. Just by fiddling with the equations you can create weird and interesting images and I for one can’t predict what I am going to create!
Here’s one last image. This one is different from most of the others, but it has a pleasing stretched and compressed feel to it:-