A Simple KmPlot Example

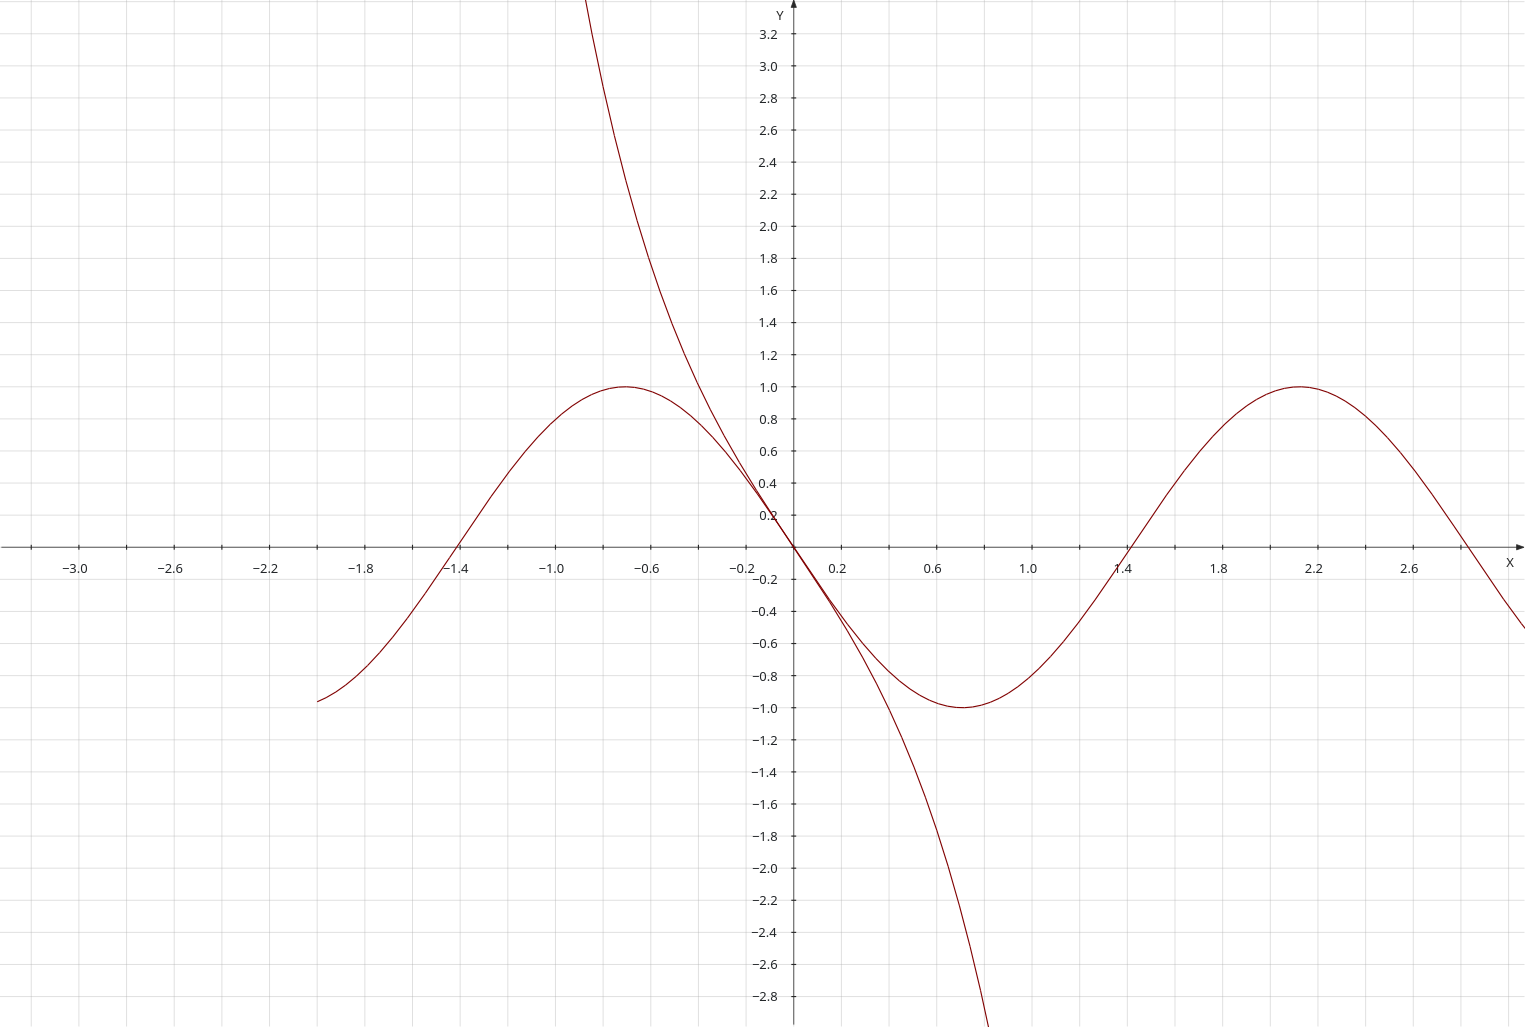
A simple sine wave is not that interesting. However adding sine waves together can produce something more aesthetically satisfying. I could, for example, add another sine wave with a higher frequency to the above simple sine wave, as shown below.

The above diagram shows the result of adding a sine wave of three times the original frequency to the first wave. Below I show the result of adding a third sine wave of five times the original fequency to the first.

A pattern is beginning to emerge from this process. I’ll add a few more terms to the summation.

This shows the sum of the terms up to the the term for the sine wave which is 13 times the original frequency. Those who have done some maths probably recognise that this is tending towards a square wave. Here’s a link to a MatLab version of what I’ve done here.

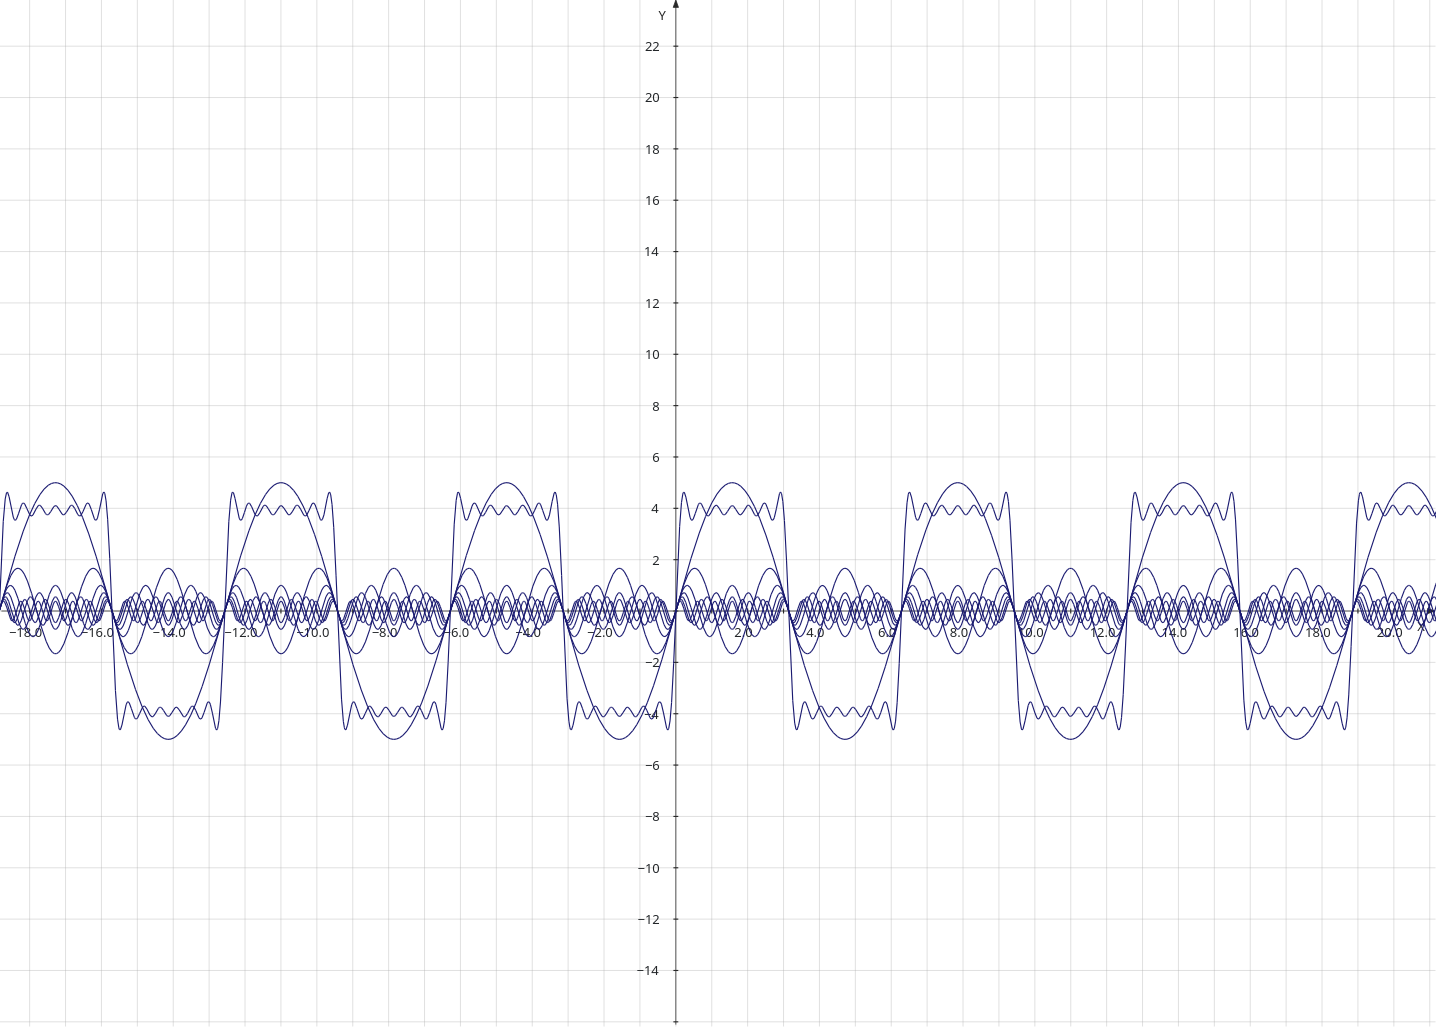
Here’s a depiction of all the individual waves that have been added together, plus the final result.

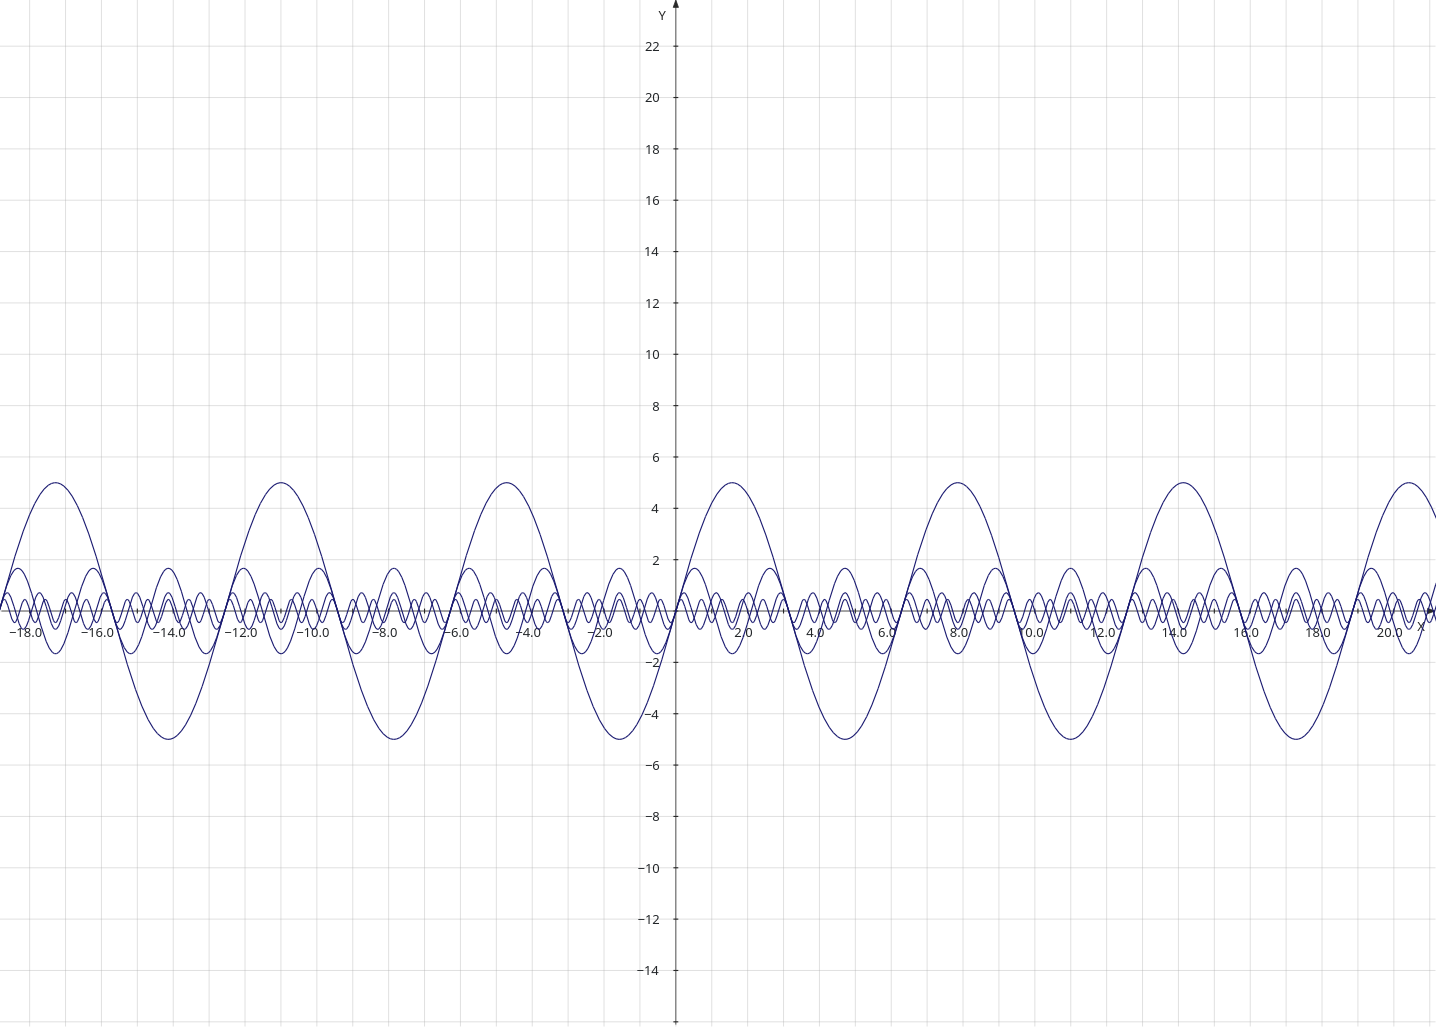
Here’s an image of just a few of the waves. It’s probably more aesthetic than the full set!

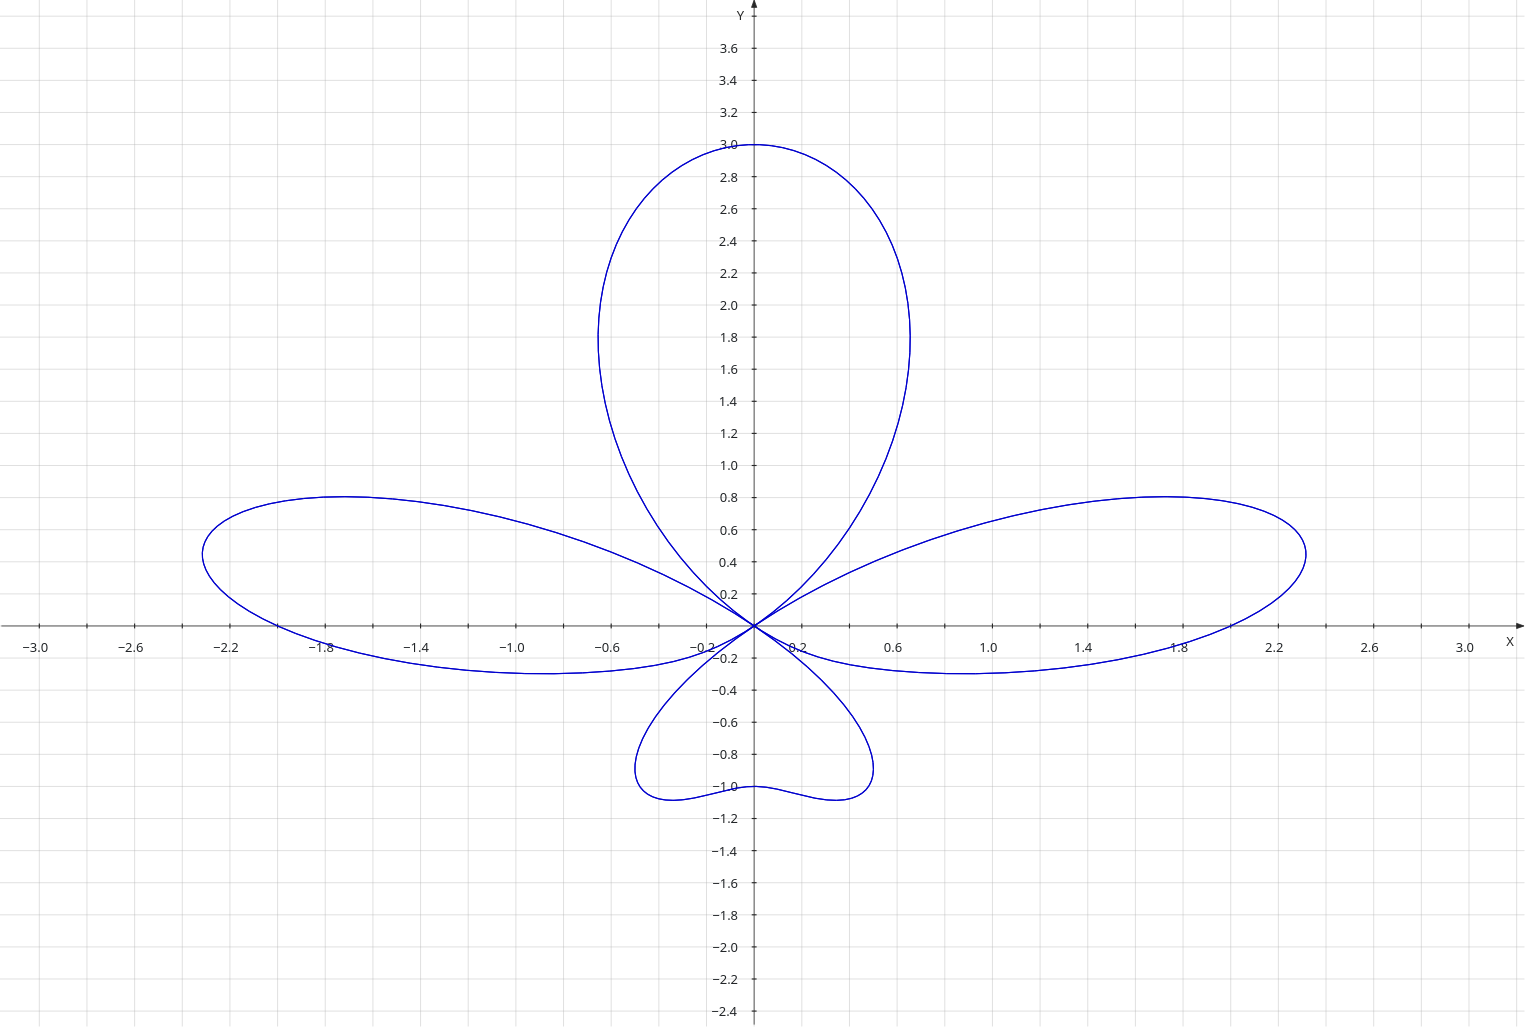
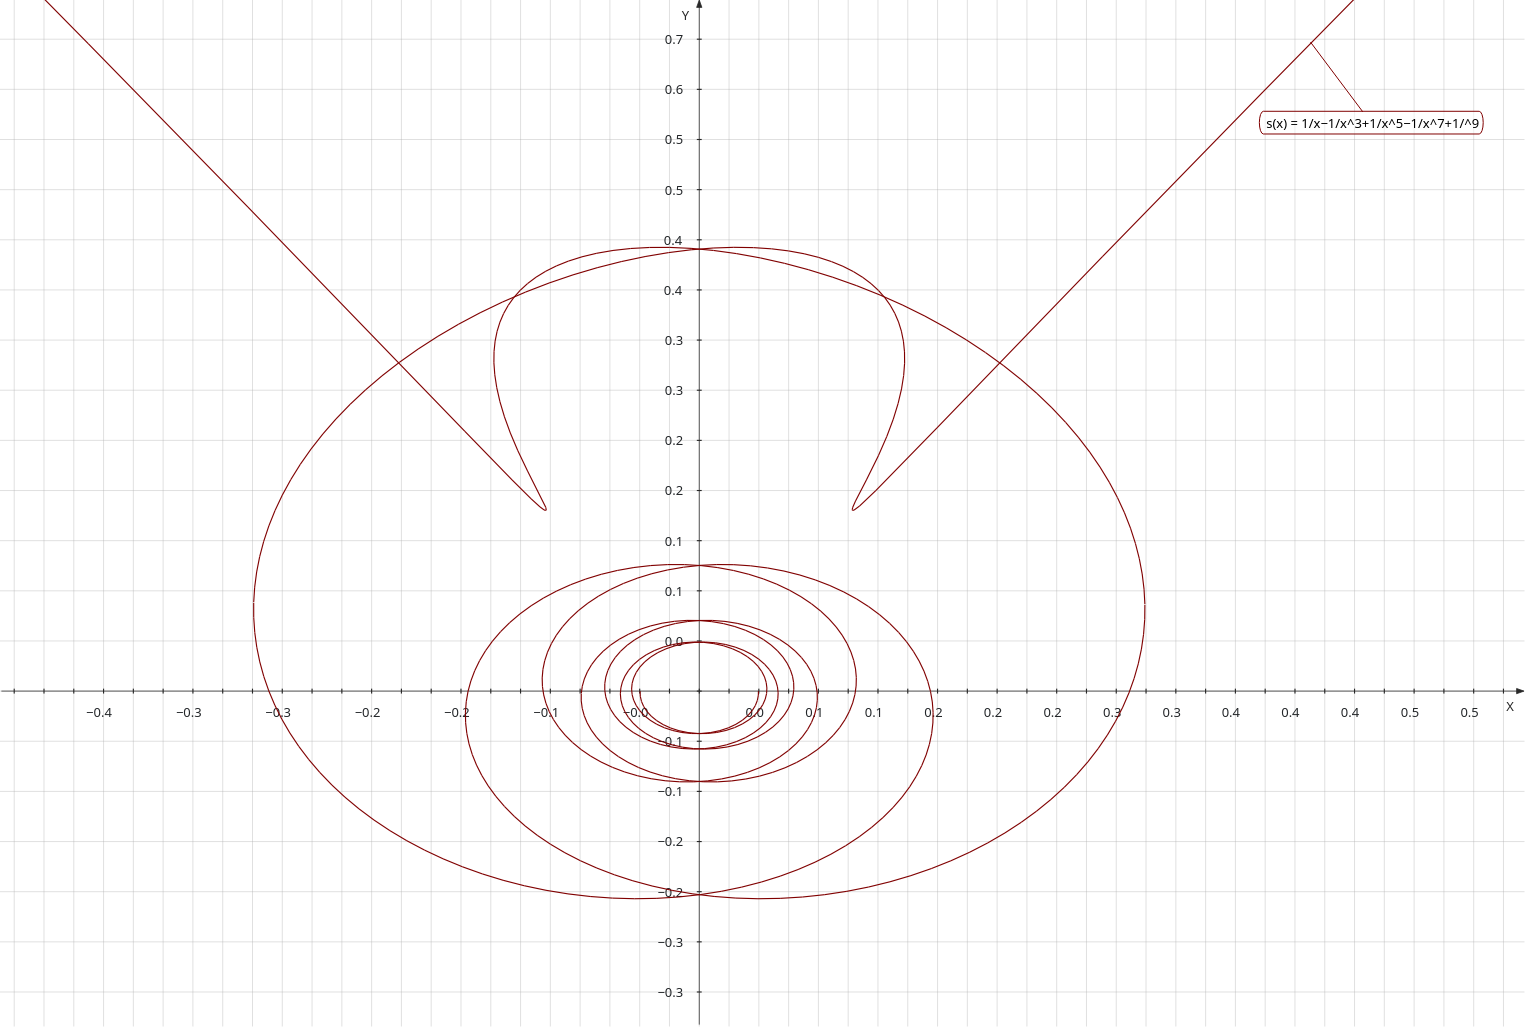
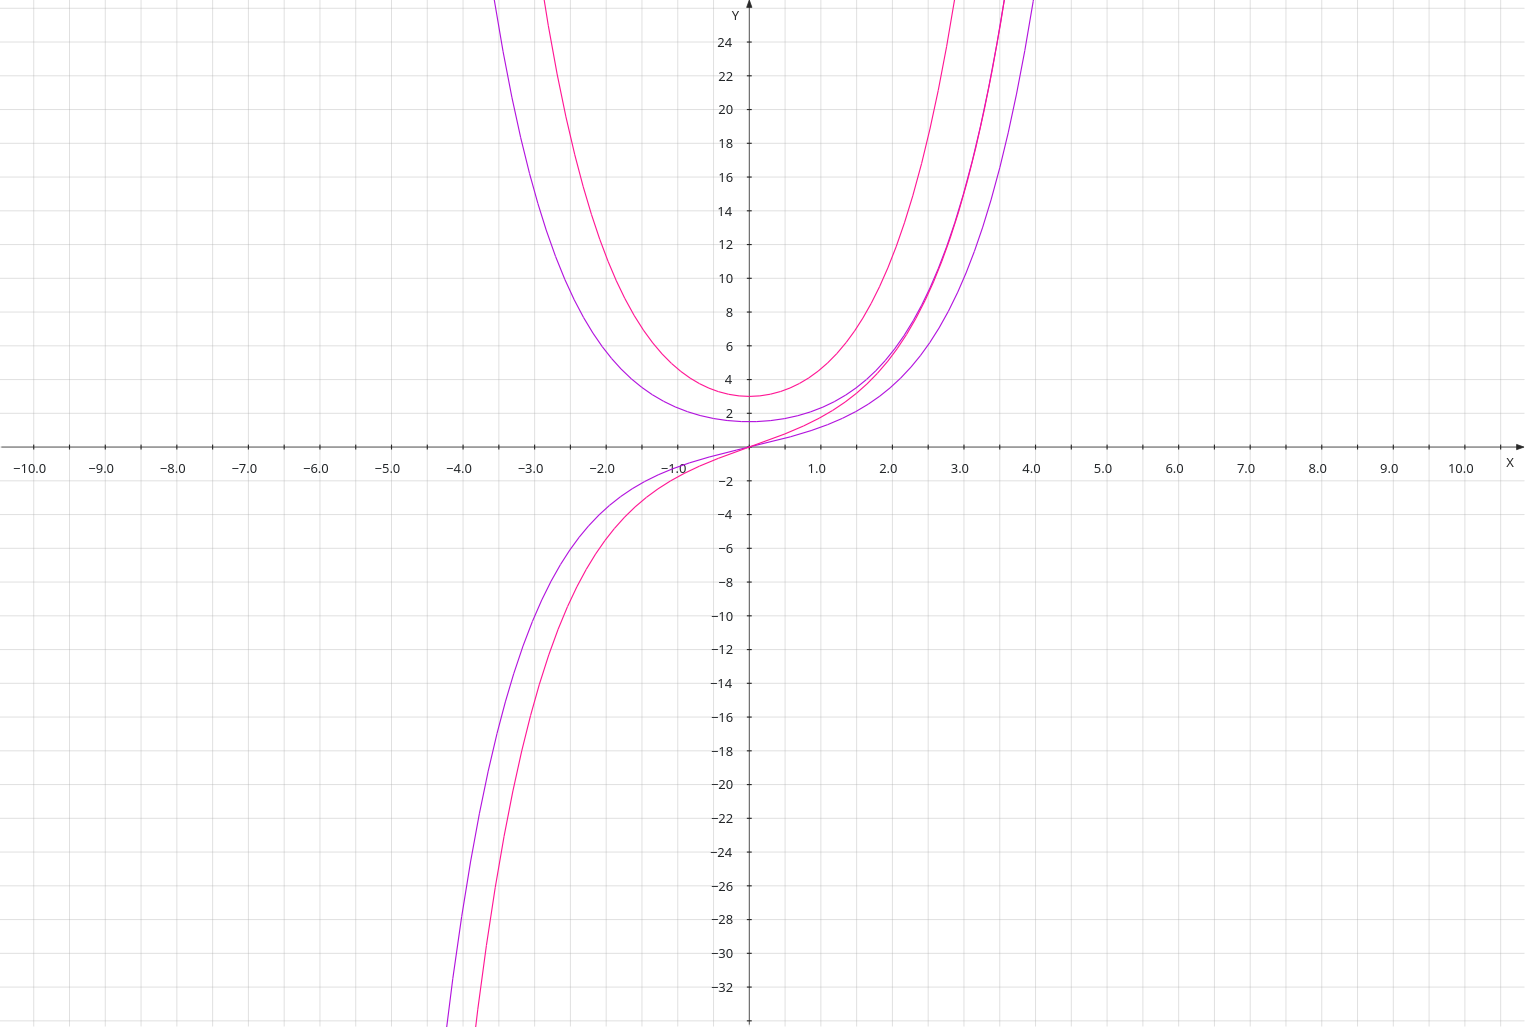
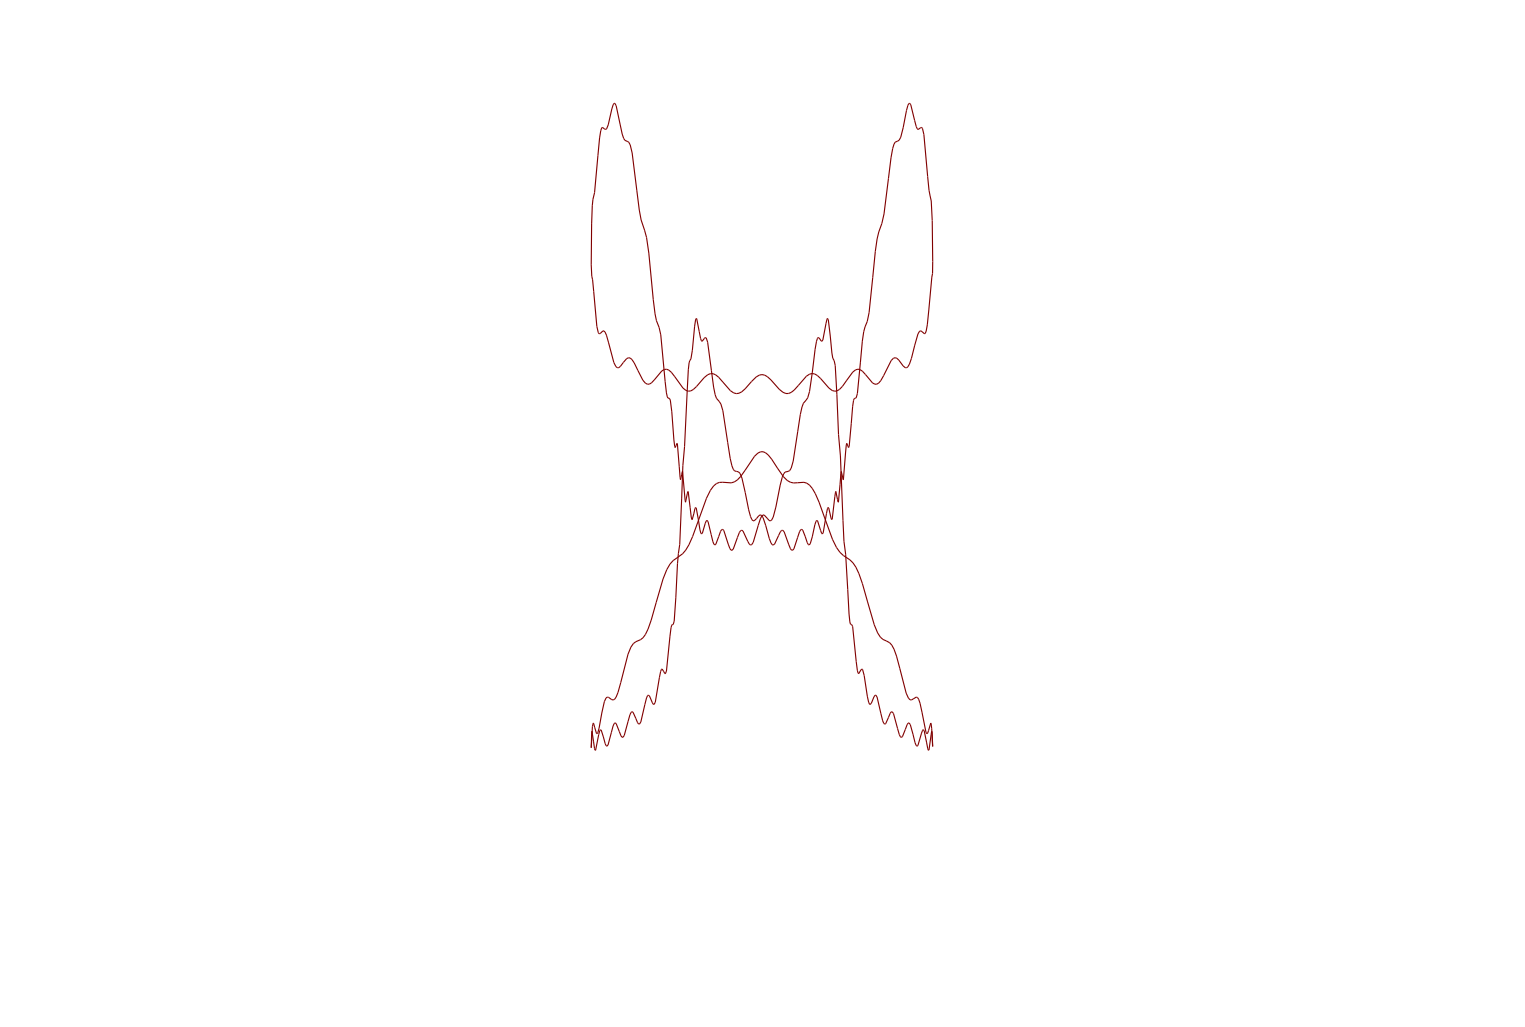
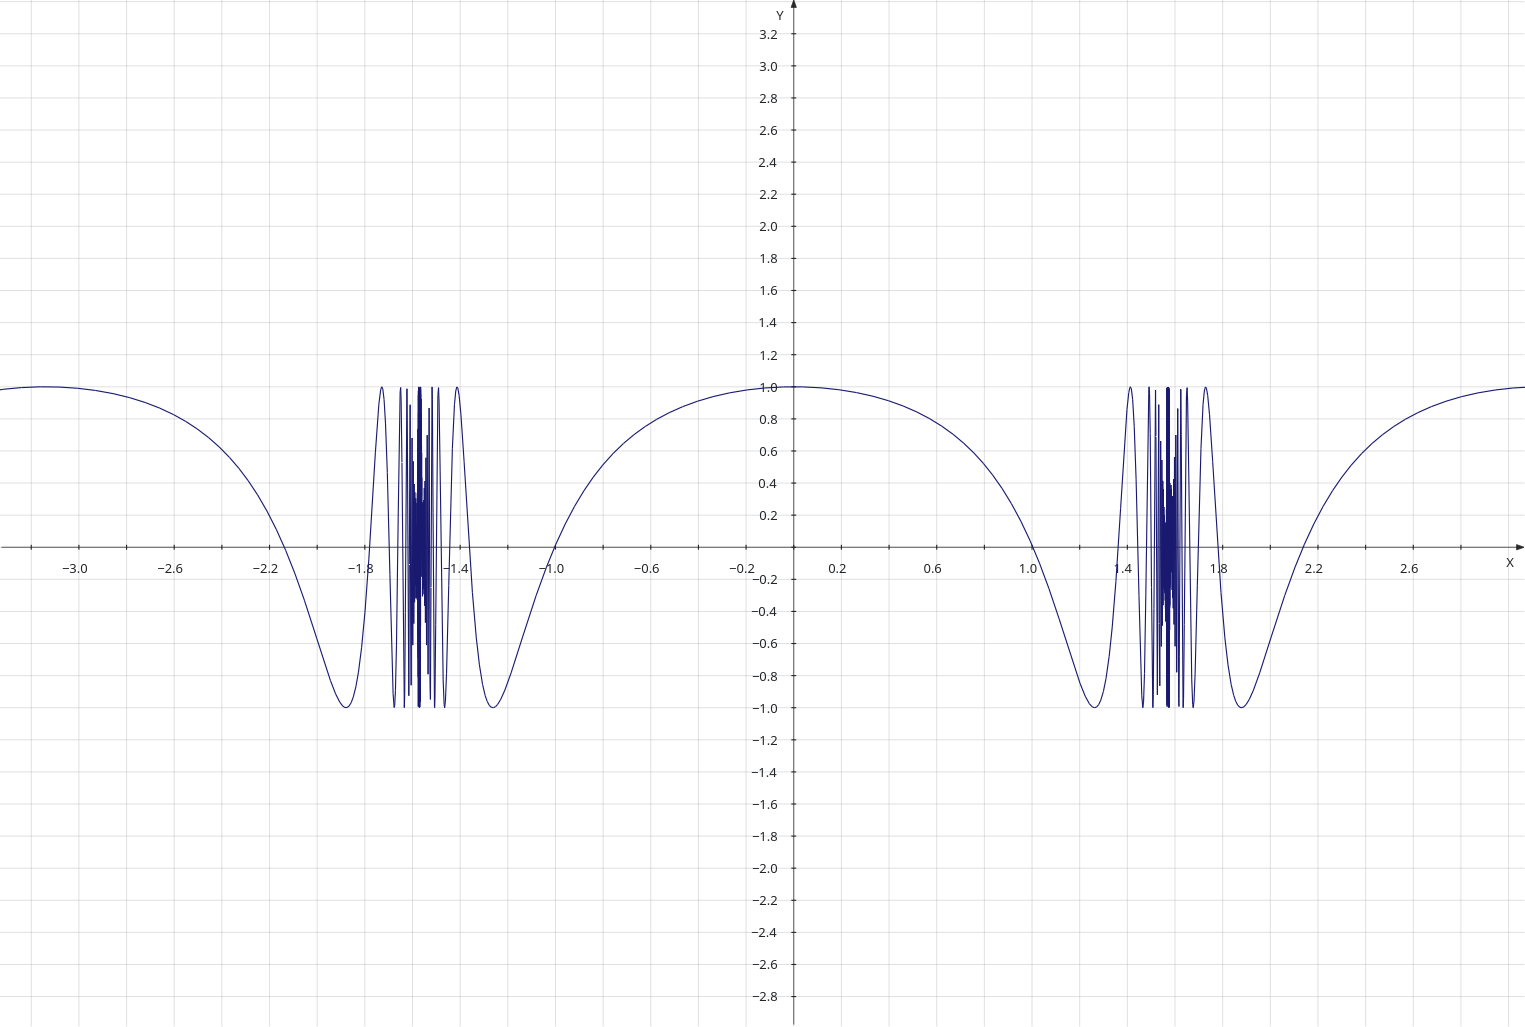
A couple of times when I was creating the above series of plots, I made mistakes, and ended up with some more interesting graphs, but I discarded those ‘mistakes’ and stuck closely to my original idea, which was to show how simply adding a few sine waves together could result in an approximate square wave.

In fact the Fourier series for a square wave can be expressed as an infinite sum of sine waves, as shown here. A fairly complex mathematical fact can be approximated by a few simple plots.

Now I’m going to go back to the ‘mistakes’ that I made and rejected earlier when developing and writing this post.

Plotting using KmPlot

I created the above image using a program called ‘KmPlot’. It is a program for the KDE desktop for plotting mathematical functions. The function that I used for the above is something like the following:-

2∙cos(y) + 1.5∙sin(3y) = cos(5x)  −0.5∙sin(9x)

I don’t plot these curves for scientific or mathematical reasons, and that is why I can’t be 100% sure of which function(s) I actually used. I plot these curves simply to create shapes and designs which I find attractive.

I continually tweak the equations that I use until I find something that I like. There is an endless array of possibilities, even with very similar equations and for example the following image:-

The equation in this case is:-

k(x) = tan(tan(x))

The two plots above use trigonometric functions, exponential function can produce some interesting images, too, like this one:-

The equation of this curve is simply:-

s(x) = 1/x−1/x^3+1/x^5−1/x^7+1/^9

I just fiddle with these equations to produce new images. For instance, the above equation has alternating terms. What would happen if I changed all the negative terms to positive ones. This is the answer to that question:-

It is similar but different. The equation is as follows:-

s(x) = 1/x+1/x^3+1/x^5+1/x^7+1/^9

Just adding sine and cosine terms together sometimes produces interesting results. Here’s one:-

In the case of these curves, the main function is made up of multiple smaller functions, so I can’t post the formula, unfortunately. A few simple curves plotted on the same plot can produce interesting images. Below is a plot of four curves of the hyperbolic trig functions, sinh and cosh. It demonstrates how an interesting image can be built up from several curves:-

At the time I created that I was trying to recreate the following image. I have the image, but I don’t have the source! It is long gone:-

Just by fiddling with the functions and adding and multiplying them together can serendipitously result in interesting images. Here’s one. I don’t recall how I created it:-

My penultimate image is the result of trying to re-create the above image. It resembles a drawing of a flying creature, and results from lucky mistakes in copying the equations:-

That’s it for now. KmPlot allows you to create simple or complex shapes using only a little bit of elementary maths. Just by fiddling with the equations you can create weird and interesting images and I for one can’t predict what I am going to create!

Here’s one last image. This one is different from most of the others, but it has a pleasing stretched and compressed feel to it:-