
My wife recently became interested in the Spirograph (™) system. Since her birthday was coming up, so did I, for obvious reasons. If you have never come across Spirograph (™) I can highly recommend it, as it enables the production of glorious swirls and spirals, using a system of toothed wheels and other shapes. When you use multicoloured pen, the results can be amazing.
Of course, I had to translate this interest into the computer sphere, and I immediately recalled “Turtle Graphics” which I have used before. It is possible to create graphics very similar to the Spirograph (™) designs very simply with Turtle Graphics.

Turtle Graphics have a long history, stretching back at least to the educational programming language Logo. Although variations of the original Logo language exist, they are fairly rare, but the concept of Turtle Graphics, where a cursor (sometimes shown as the image of a cartoon turtle) draws a line on a page, still exists. The turtle can be directed to move in a particular way, based on instructions by the programmer.
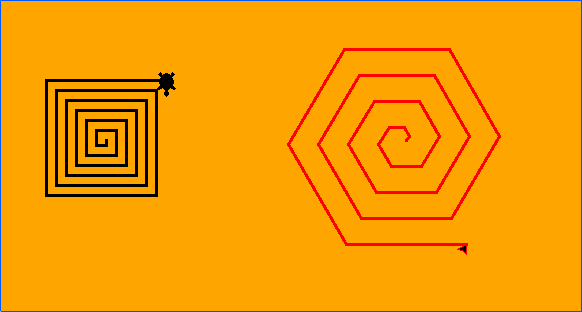
For instance the turtle can be instructed to move forward a certain distance, turn right through 90°, and repeat this process three times. The result is a small square. Or the turtle could be instructed to move forward and turn only 60°, repeating this 5 times to draw a hexagon. Using simple instructions like this allow the drawing of practically anything.
I use an implementation of Turtle Graphics in the turtle module of the Python programming language but it is probably available for other programming languages. Python is probably an easy language to learn from scratch than Logo, and in addition Python can be used for many other things than Turtle Graphics. Python is available for Windows, OS/X, and Linux/Unix, and for several other older or less well known platforms.
Where things become interesting is when the looping abilities of Python are used to enhance a program. If the programmer gets the turtle to draw a square, then makes the turtle turn a little and repeats the process, the result is a circular pattern. Starting with a more interesting shape can produce some interesting patterns.

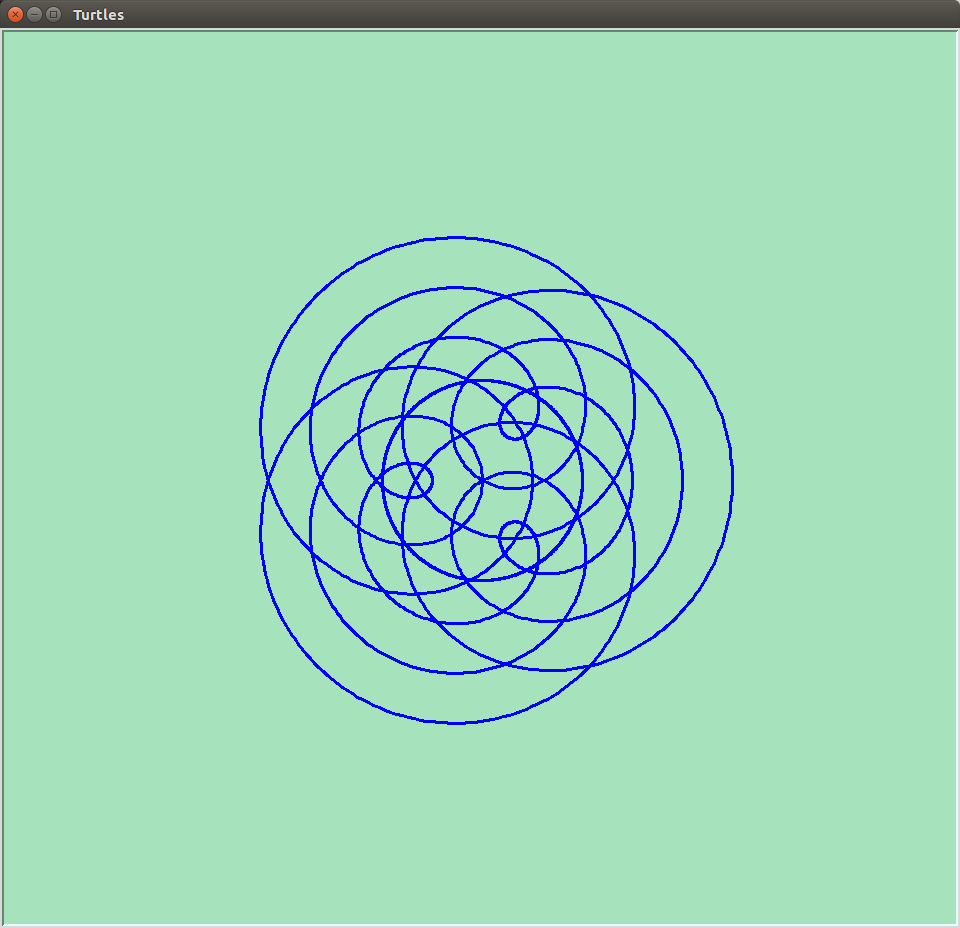
After a while, though, the patterns begin to seem very similar to one another. One way to add a bit of variation is to use the ability to make the turtle move to a specific position, drawing a line on the way. As an example, consider a stick hinged to another stick, much like a nunchaku. If one stick rotates as a constant speed and the second stick rotates at some multiple of that, then the end of the second stick traces out a complex curve.

In Python this can be expressed like this:
x = int(a * math.sin(math.radians(c * i)) + b * math.sin(math.radians(d * i)))
y = int(a * math.cos(math.radians(c * i)) + b * math.cos(math.radians(d * i)))
where c and d are the rates of rotation of the two sticks and and b are the lengths of the stick. i is a counter that causes the two sticks to rotate. If the turtle is moved to the position x, y, a line is drawn from the previous position, and a curve is drawn.
The fun part is varying the various parameters, a, b, c, d, to see what effect that has. The type of curve that is created here is an epicycloid. For larger values of c and d the curves resemble the familiar shapes generated by Spirograph (™).
The equations above use the same constants in each equation. If the constant are different, some very interesting shapes appear, but I’m not going to go into that here. Suffice it to say, I got distracted from writing this post by playing around with those constants!
The above equations do tend to produce curves with radial symmetry, but there is another method that can be used to produce other curves, this time with rotational symmetry. For instance, a curve can be generated by moving to new point depending on the latest move. This process is then iterative.
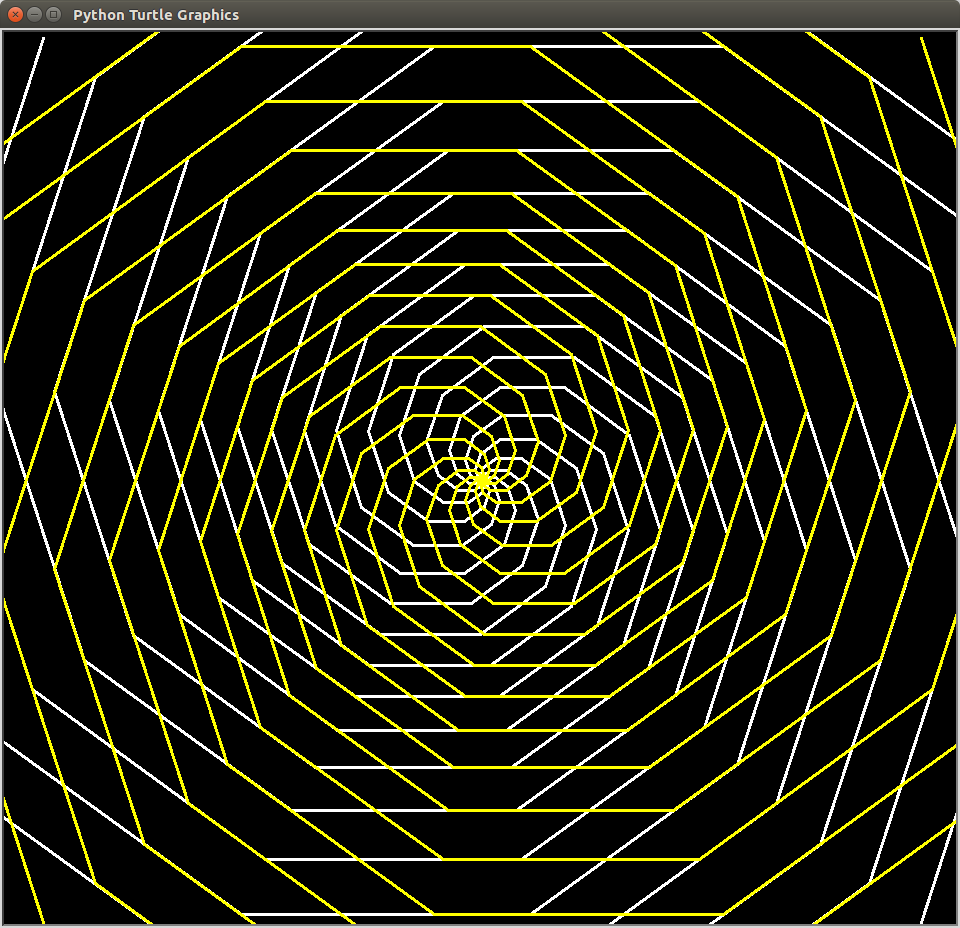
For instance, the next position could be determined by turning through an angle and move forward a little more than the last time. Something like this snippet of code would do that:
for i in range(1, 200):
t.forward(a)
t.pendown()t.left(c)
a = a + 1
c = c + 10
This brings up a point of interest. If you run code like this, ensure that you don’t stop it too soon. This code causes the turtle to spin and draw in a small area for a while, and then fly off. However it quickly starts to spin again in a relatively small area before once more shooting off again. Evidently it repeats this process as it continues to move off in a particular direction.

Another use of turtle graphics is to draw graphs of functions, much like we learnt to do in school with pencil and squared paper. One such function is the cycloid function:
x = r(t – sine(t))
y = r(1 – cosine))
This function describes the motion of a wheel rolling along a level surface and can easily be translated into Python. More generally it is the equation of a radius of a circle rolling along a straight line. If a different point is picked, such a point on a radius inside the circle or a point outside the circle on the radius extended, a family of curves can be generated.

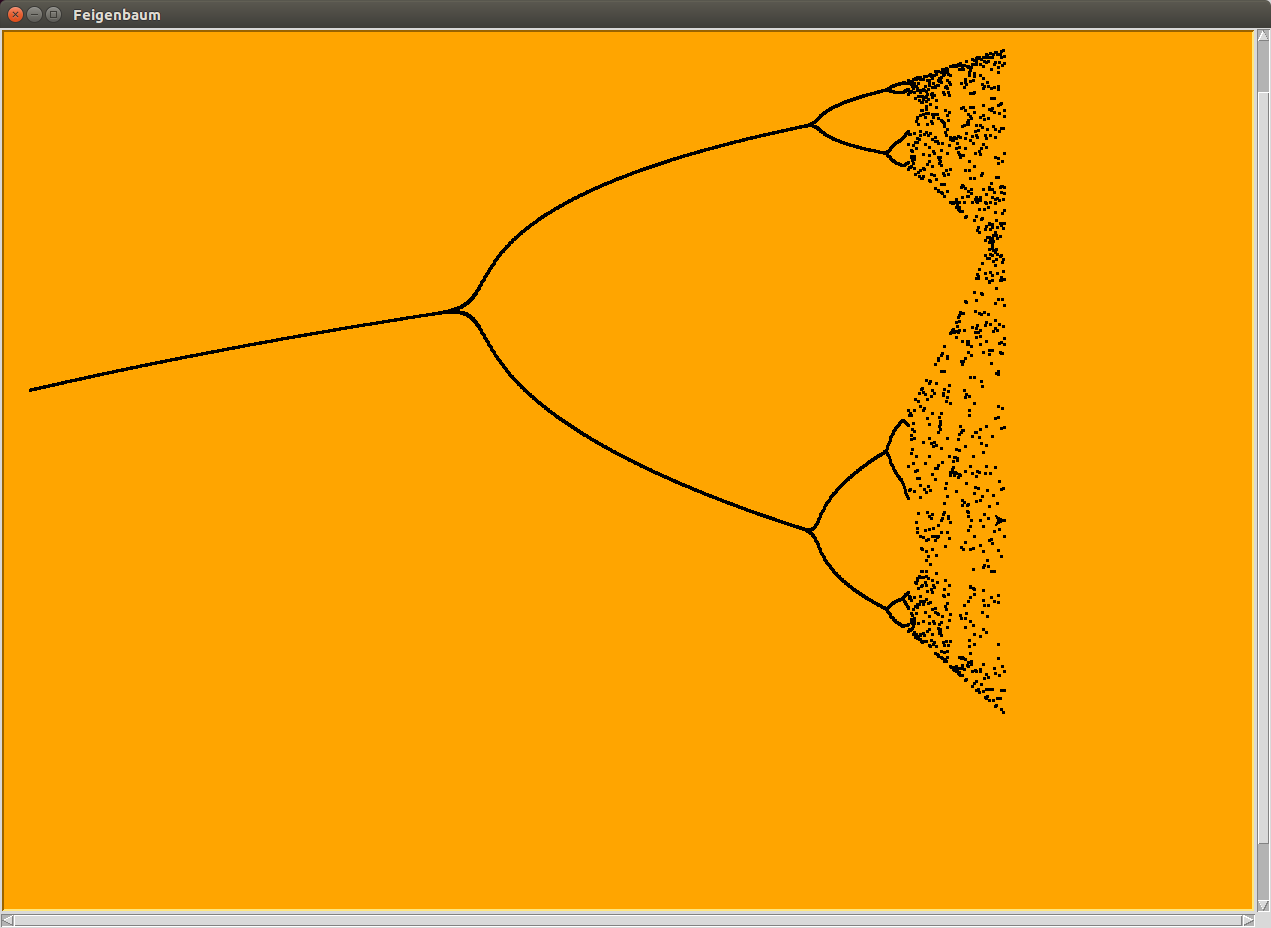
Finally, a really technical example. An equation like the following is called a dynamic equation. Each new ‘x’ is generated from the equation using the previous ‘x’. If this process is repeated many times, then depending on the value of ‘r’, the new value of ‘x’ may become ever closer to the previous value of ‘x’.
x(n+1) = rx(n)(1 – x(n))
If the value of ‘r’ is bigger than a certain value and less than another value, then ‘x’ flip-flops between two values. If the value of ‘r’ is bigger than the other value, and smaller than yet another value then ‘x’ rotates between 4 values. This doubling happens again and again in a “period doubling cascade“.

I’ve written a turtle program to demonstrate this. First a value for ‘r’ is chosen, then the equation is repeated applied 1,000 times, and the next 100 results are plotted, x against r. In the end result, the period doubling can easily be seen, although after a few doubling, the results become messy (which may be related to the accuracy and validity of my equations, and the various conversion between float and integer types).

Hi, I like the figures you have produced in your turtle spirograph blog, especially the blue ones. Can you give me the (a, b, c, d) values for these two figures? Thanks.
Sorry, I would fiddle with the parameters and save the graphs that I liked. Also I parameterized the program so that I could try easily try various combinations of parameters. So I don’t have the figures for the graphs, sorry.